Path: Workspace Homepage >> Navigation Panel >> Reporting
Reports visually represent information, making it easier to understand and analyze the data at hand. The Reports page provides a comprehensive list of both system-generated charts and those you have created. Admins can incorporate these charts into the dashboard to effectively display reports on the parameters they wish to monitor.
TABLE OF CONTENTS
List of Reports
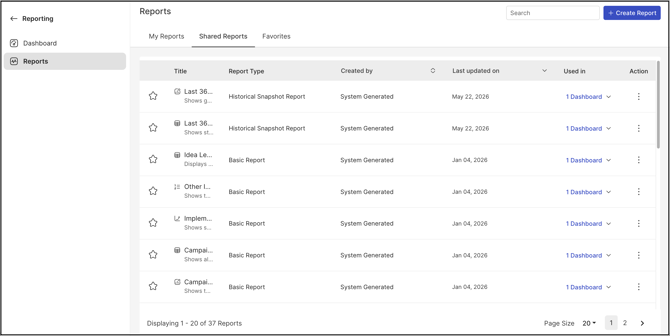
The list of reports presents all available reports along with their titles, the creator's name, the date of the last update, the number of dashboards in which each report is utilized, and available actions. The "Used In" column indicates how many dashboards incorporate the specific report, and you can click on this to reveal a dropdown menu showing the names of those dashboards. By selecting a dashboard name, you will be redirected to that specific dashboard for further review.
Actions
The Actions header provides a dropdown menu containing various actions admin can perform related to the report. These options closely resemble those found in the dashboard, allowing for a familiar user experience. The options will vary for System-generated and custom reports.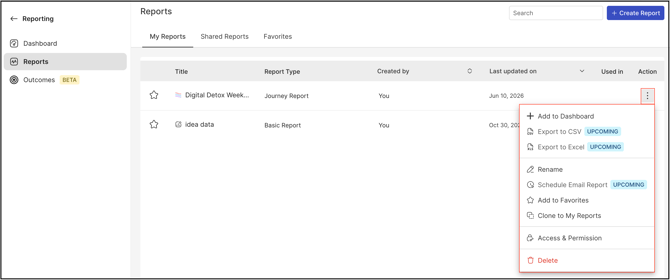
The list are as follows:
1. Add to Dashboard
2. Export data to CSV (Upcoming)
3. Export data to Excel (Upcoming)
4. Rename (Not available for system-generated reports)
5. Schedule Email report (Upcoming)
6. Add to favourites
7. Clone to My Reports (Not available for system-generated reports)
8. Access & Permission (Not available for system-generated reports)
9. Delete (Not available for system-generated reports)
Create Report

To create a report that meets specific needs as an administrator, follow a few straightforward steps. Begin by clicking on the Create Report option. Ideascale has introduced three types of reports:
1. Basic Report
2. Historical Snapshot Report
3. Journey Report
In order to create any type of report, admin will need to click on one of the report type. Once selected, they can proceed to customize the report by selecting the report type, specifying the date category, setting the desired time frame, and applying any relevant filters. This customization will help to achieve the results.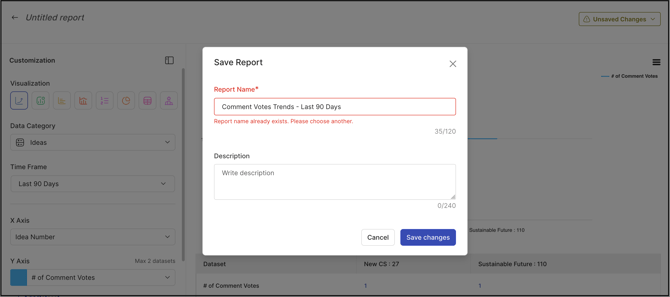
The report name must be unique and cannot duplicate the name of an existing report. Trying to use an existing report name will give the above error message.
Basic Report
This report allows you to choose and customize the report from the various data category and select the data you would like to see on the X and Y axis.
The customizable elements in the reports are as follows:
1. Report Type: You could choose from the various report types like line, bar, horizontal bar, dual axis, metric card, donut and table report.
2. Data Category: This will have only two categories one being Idea and the other Member.
3. Time Frame: Custom timeframe is required to track data throughout the reporting tool.
- When selecting a time frame to apply to the report, the user will be able to select from the following options:
- Last 7 days
- Last 30 days
- Last 90 days
- Last 180 days
- Last 365 days
- All Time (only available for Metric Card)
- Custom Range: Custom range will allow the user to select a time frame from a calendar.
4. X Axis: The available datasets in the dropdown menu will vary based on the selected data category. However, the frequency option will remain accessible regardless of the chosen category.
In case of Ideas selected in data category you will have the following datasets to choose from:
- Time Properties
- Daily
- Weekly
- Monthly
- Quarterly
- Yearly
- Idea Properties:
- Idea Number
- Idea Title
- Idea Submission Date
- Idea Submitter
- Idea Owner
- Stage
- Campaign Group
- Campaign
- Community
- Workspace Group
- Community Group
- Idea Custom Fields
- Workspace Member Profile Questions
- Member Profile Questions
If the selection is Member in the Data category you will see the below options in the dropdown:
- Time Properties
- Daily
- Weekly
- Monthly
- Yearly
- Member Properties
- Member Email
- Member Status
- Campaign
- Community Group
- Workspace Group
- Workspace Member Profile Questions
- Member Profile Questions
5. Y Axis: The available datasets in the dropdown menu will vary based on the selected data category.
Idea Data Category
- Ideas Submitted – number of ideas submitted within the timeframe
- Idea Views – number of total idea views within the timeframe
- Idea Votes – number of total idea votes within the timeframe
- Idea Upvotes – number of total idea upvotes within the timeframe
- Idea Downvotes – number of total idea downvotes within the timeframe
- Idea Net vote - number of net votes within the timeframe
- Comment Votes - number of votes on comments within the timeframe
- Comment UpVotes - number of upvotes on comments within the timeframe
- Comment DownVotes - number of downvotes on comments within the timeframe
- Total Vote - number of total votes within the timeframe
- Number of Comments – number of total comments within the timeframe
- Number of Shares – number of total idea shares within the timeframe
- Tags Applied – number of total times a tag was applied within the timeframe
- Engagement Actions – total engagement actions taken in the time frame (idea submission, vote (idea or comment), stage action, comment, share, give kudos, tag, label)
- Reviews Completed - number of times an individual user has completed ALL review questions on a particular idea.
- Assessments Completed- number of times an individual user has completed ALL assessment questions on a particular idea.
- Estimations Completed - number of times individual users have completed all estimates for a particular idea.
- Refinements Submitted - number of times all refinement questions are completed for an idea.
- Fund Allocations - Number of times users have pledged funds to an idea. This is based on the “MEMBER_PLEDGE_FUND” event and counts each pledge (including if a single user pledges to the same idea multiple times)
- Build Team Activity Count - number of team member activity within the timeframe
- Net Activity Score - The Net Activity Score is calculated by summing the key activities that occur within your community. Idea submissions, comments, votes, and stage actions are combined in a simple way to reflect the total activity.
- Idea Stage Changes - number of idea stage changed within the timeframe
- Moderator Activity Count - number of moderator activity within the timeframe
- Moderator Activity Per Idea - number of moderator activity on an idea within the timeframe
- Selected Ideas - number of selected ideas within the timeframe
- Implemented Ideas - number of implemented ideas within the timeframe
- Assessment Score - displays the score for the ideas in the assessment stage.
- Review Score - displays the score for the ideas in the reviewscale stage.
- Estimate ROI - displays estimated ROI for the ideas
- Fund collected - displays the fund collected for the ideas.
Member Data Category
- Total Members – total number of members in the workspace within the timeframe (over time)
- Engaged Members – total number of members that completed an engagement action in the timeframe
- New Members – new members added during the time frame
- Total Logins – total number of times users have logged-in within the time frame
- Unique Logins Count – number of different users who have logged in at least once within the timeframe
- Total Visits – total number of times users have visited the workspace within the time frame (will filter down to community/campaign with filters/x axis options)
- Unique Visits Count – number of different users who have visited the workspace within the time frame (will filter down to community/campaign with filters/x axis options)
- Kudos Given – number of total kudos given within the timeframe
For Metric Card, Donut and Table, the Time properties appear under Data Grouping element.
Filters in Report
.png?width=670&height=327&name=Screenshot%202025-04-10%20at%2010%20(1).png)
Reports can be filtered using our new filtering system to gain even deeper insights into your data. Filter will be selectable based on the data category that is selected when building your report.
Idea Data Category: The selection could be applied as per the following categories from the dropdown available in the WHERE filter
1. Workspace - Workspace Group
2. Community - Community (Selection dropdown), Community name (Text box to enter name) and Community Group (Selection dropdown)
3. Idea Properties - Idea, Idea Number, Idea Title, Idea Description, Idea Submission Date and Label
4. Idea Owner - Owner, Owner Email, Owner Source, Owner Registration Date, Owner Status and Owner Profile Language.
5. Idea Submitter - Submitter, Submitter Email, Submitter Source, Submitter Registration Date, Submitter Status and Submitter Profile Language.
6. Stage Properties - Stage, Stage Name, Stage Description, Stage Function, Funnel, Recycle Bin and Pending.
7. Campaign Properties - Campaign, Campaign Group, Campaign Title, Campaign Subtitle, Question/Challenge Statement, Campaign Start Date, Campaign End Date, Campaign Privacy, Campaign Language, Idea Submission Start Date and Idea Submission End Date.
8. Engagements - Idea Submitter, Idea Views, Idea Votes, Idea Shares, Idea Comments, Idea Up Votes, Idea Down Votes, Comments, Comment Up Votes, Comment Down Votes, Kudos Given, Tag Usage, Engagement Actions, Review Completed, Assessment Completed, Estimation Completed, Refinement Completed and Fund Allocations
9. Idea Custom Fields - Single or Multiple choice Idea Custom Fields are displayed in Campaign-wise dropdown.
10. Workspace Member Profile Questions -All the Workspace-level single-choice and multiple-choice Member profile questions are displayed.
11. Member Profile Questions - All the Community-level single-choice and multiple-choice Member profile questions are displayed.
Member Data Category: The selection could be applied as per the following categories from the dropdown available in the WHERE filter
1. Workspace - Workspace Group
2. Community - Community and Community Group
3. Campaign Properties - Campaign, Campaign Group, Campaign Title, Campaign Subtitle, Question/Challenge Statement, Campaign Start Date, Campaign End Date, Campaign Privacy, Campaign Language, Idea Submission Start Date and Idea Submission End Date.
4. Engagements - Kudos Given, Engaged Members, Login Count, Unique Login Count, Visit Count and Unique Visit Count
5. Member Properties - Member Email, Member Status, Member Source, Member Registration Date, Member Profile language
6. Workspace Member Profile Questions - It only shows Single-choice or Multiple-choice profile questions from Workspace.
7. Member Profile Questions - It only shows Single-choice or Multiple-choice profile questions from each Community.
Variable: The variables are Equals, Does not equal, Starts with, Ends with, Contains, Does not start with, Does not end with, Does not contain, Defined or Undefined.
Type: Under Type field enter the text to compare with. The fields with answer options also provide a dropdown to choose from.
And/Or option: The OR and AND options can be used to filter out the data.
The filters can also be saved to be used later. The saved filter can be retrieved from the top right corner.
