- IdeaScale Support Center
- Reporting & Analysis
Campaign Report
Campaign Report
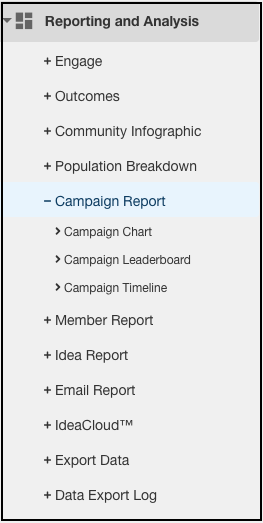
Path: Settings Dropdown >> Reporting & Analysis >> Campaign Report
The Campaign Report gives you a graphical representation of your campaign which shows the activity taken place within your community, including number of Ideas, number of Votes, and number of Comments.
Campaign Chart
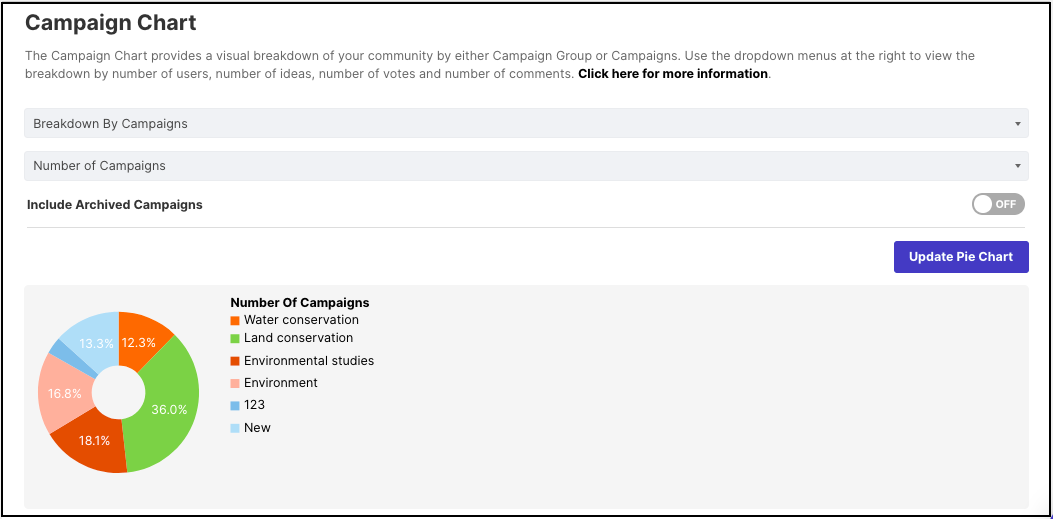
This chart provides you with a breakdown of your community based on campaign or campaign group. You can also get a breakdown of different parameters like the number of Campaigns, Users, Ideas, Votes & Comments in a pie chart.
Campaign Leaderboard
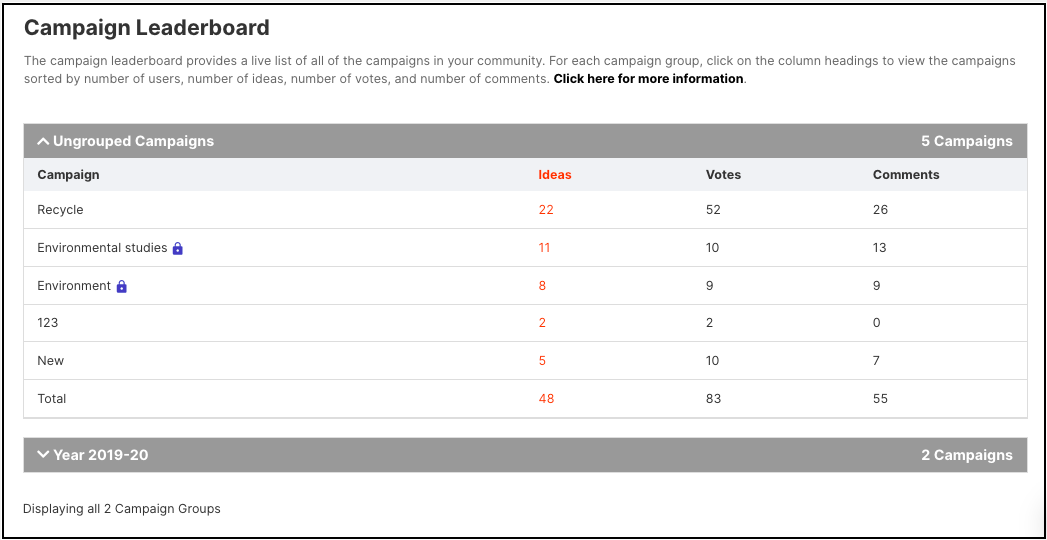
Campaign leaderboard gives you a quick look at the number of ideas, votes & comments posted per campaign group in the community. It also denotes the private campaign with a lock icon.
Campaign Timeline
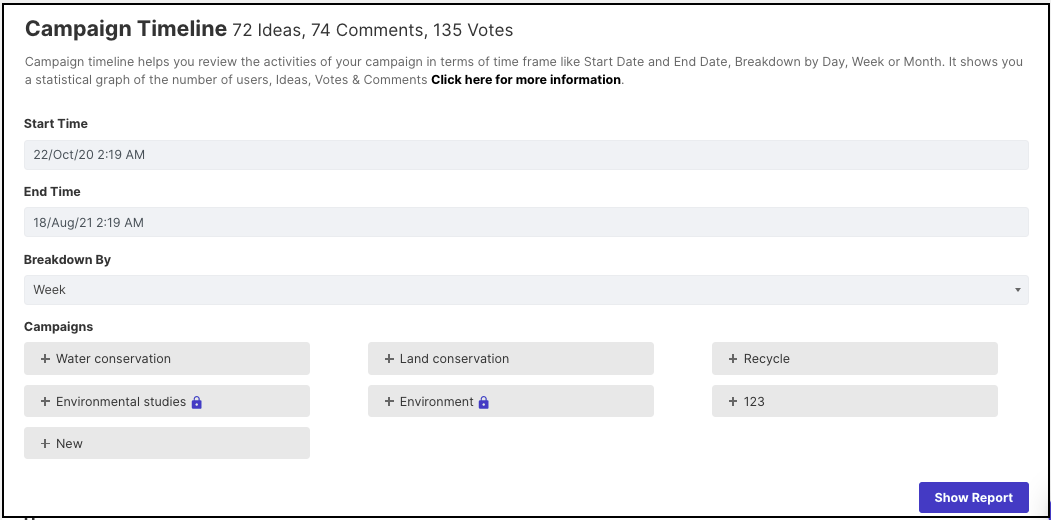
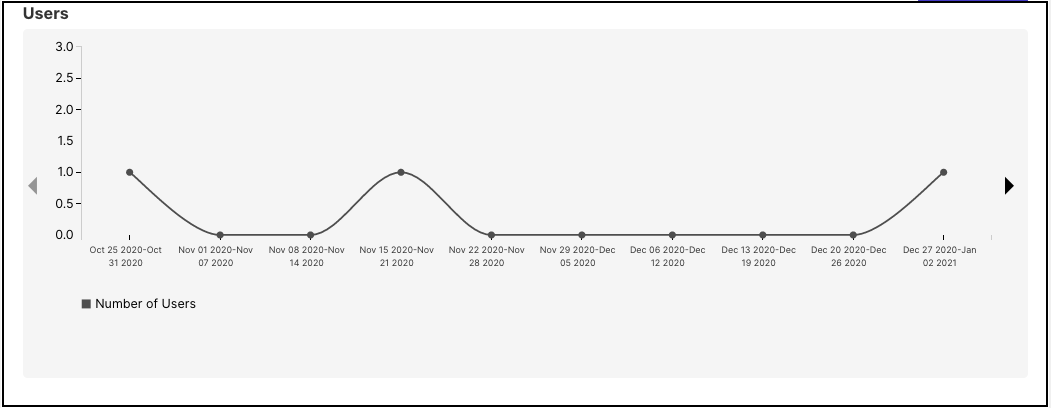
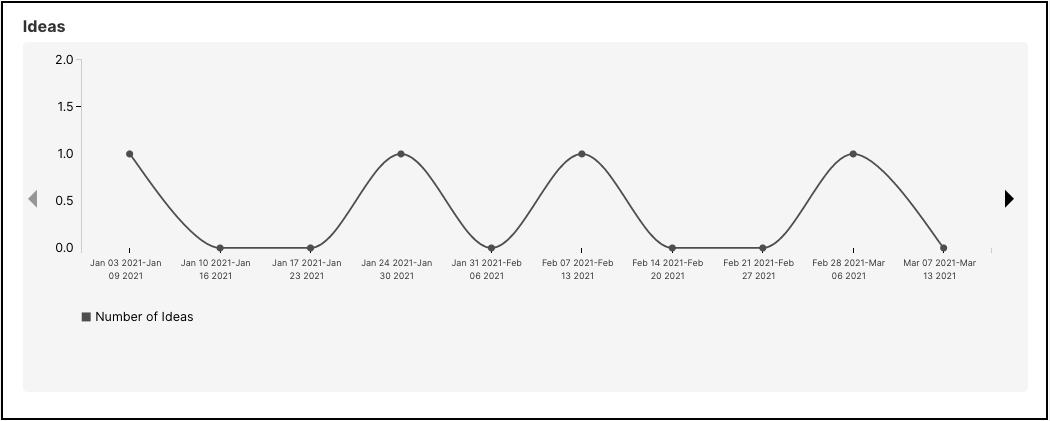
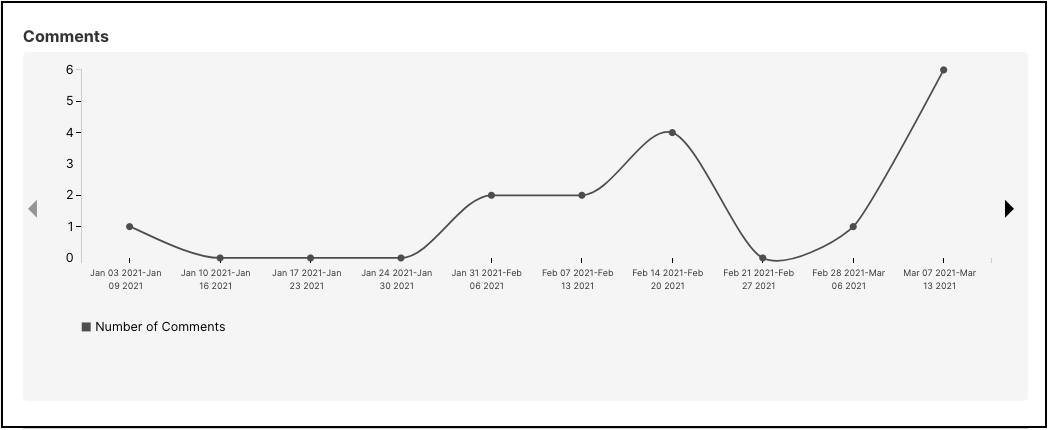
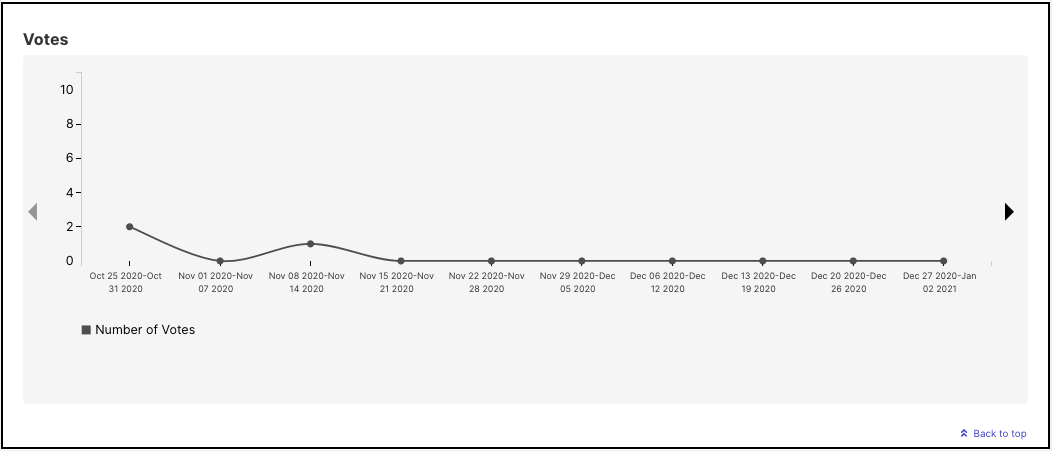
Campaign timeline helps you review the activities of your campaign in terms of time frame like Start Date and End Date, Breakdown by Day, Week, or Month. It can also be viewed for single or multiple campaigns at a time. It shows you a statistical graph of the number of users, ideas, votes & comments.
Note: These reports cannot be downloaded.
Last Updated: September 17, 2023