Path: Profile Dropdown >> Reporting & Analysis >> Engage
This article will walk you through the various components of the Engagement Dashboard.

Community Summary:

Shows a snapshot of the cumulative activity your efforts have generated!
The community summary will help you monitor activities on a global level and set goals for increasing certain activities per capita. It shows a snapshot of the total number of ideas, total comments, total votes, and the total number of users in your community. The total number of users shows all registered members in the community.
Note:
The number of ideas are counted as per the following:
- Private ideas, Pending approval ideas, anonymous ideas - count increases.
- Off topic ideas, Recycle bin ideas, Abuse/ Duplicate ideas - count unchanged.
- Deleted ideas, deleted campaigns ideas, nuke members ideas - count decreases.
The number of comments are counted as per the following:
- Private comments, Pending approval comments, anonymous comments - count increases.
- Abuse comments - count unchanged.
- Deleted comments, deleted campaigns idea comments, nuke members comments - count decreases.
The number of votes are counted as per the following:
- Up vote, down vote, vote on private idea, vote on anonymous idea - count increases.
- Retract Up vote, Retract down vote, deleted campaigns idea vote - count decreases.
- Votes on Pending Ideas, Votes on Recycle Ideas - count unchanged.
- Votes on Off-Topic Ideas - Not applicable.
The number of members are counted as per the following:
- Unapproved member - count increases.
- Banned member (any option used to ban), merged member, Nuke member - count decreases.
Activity Summary
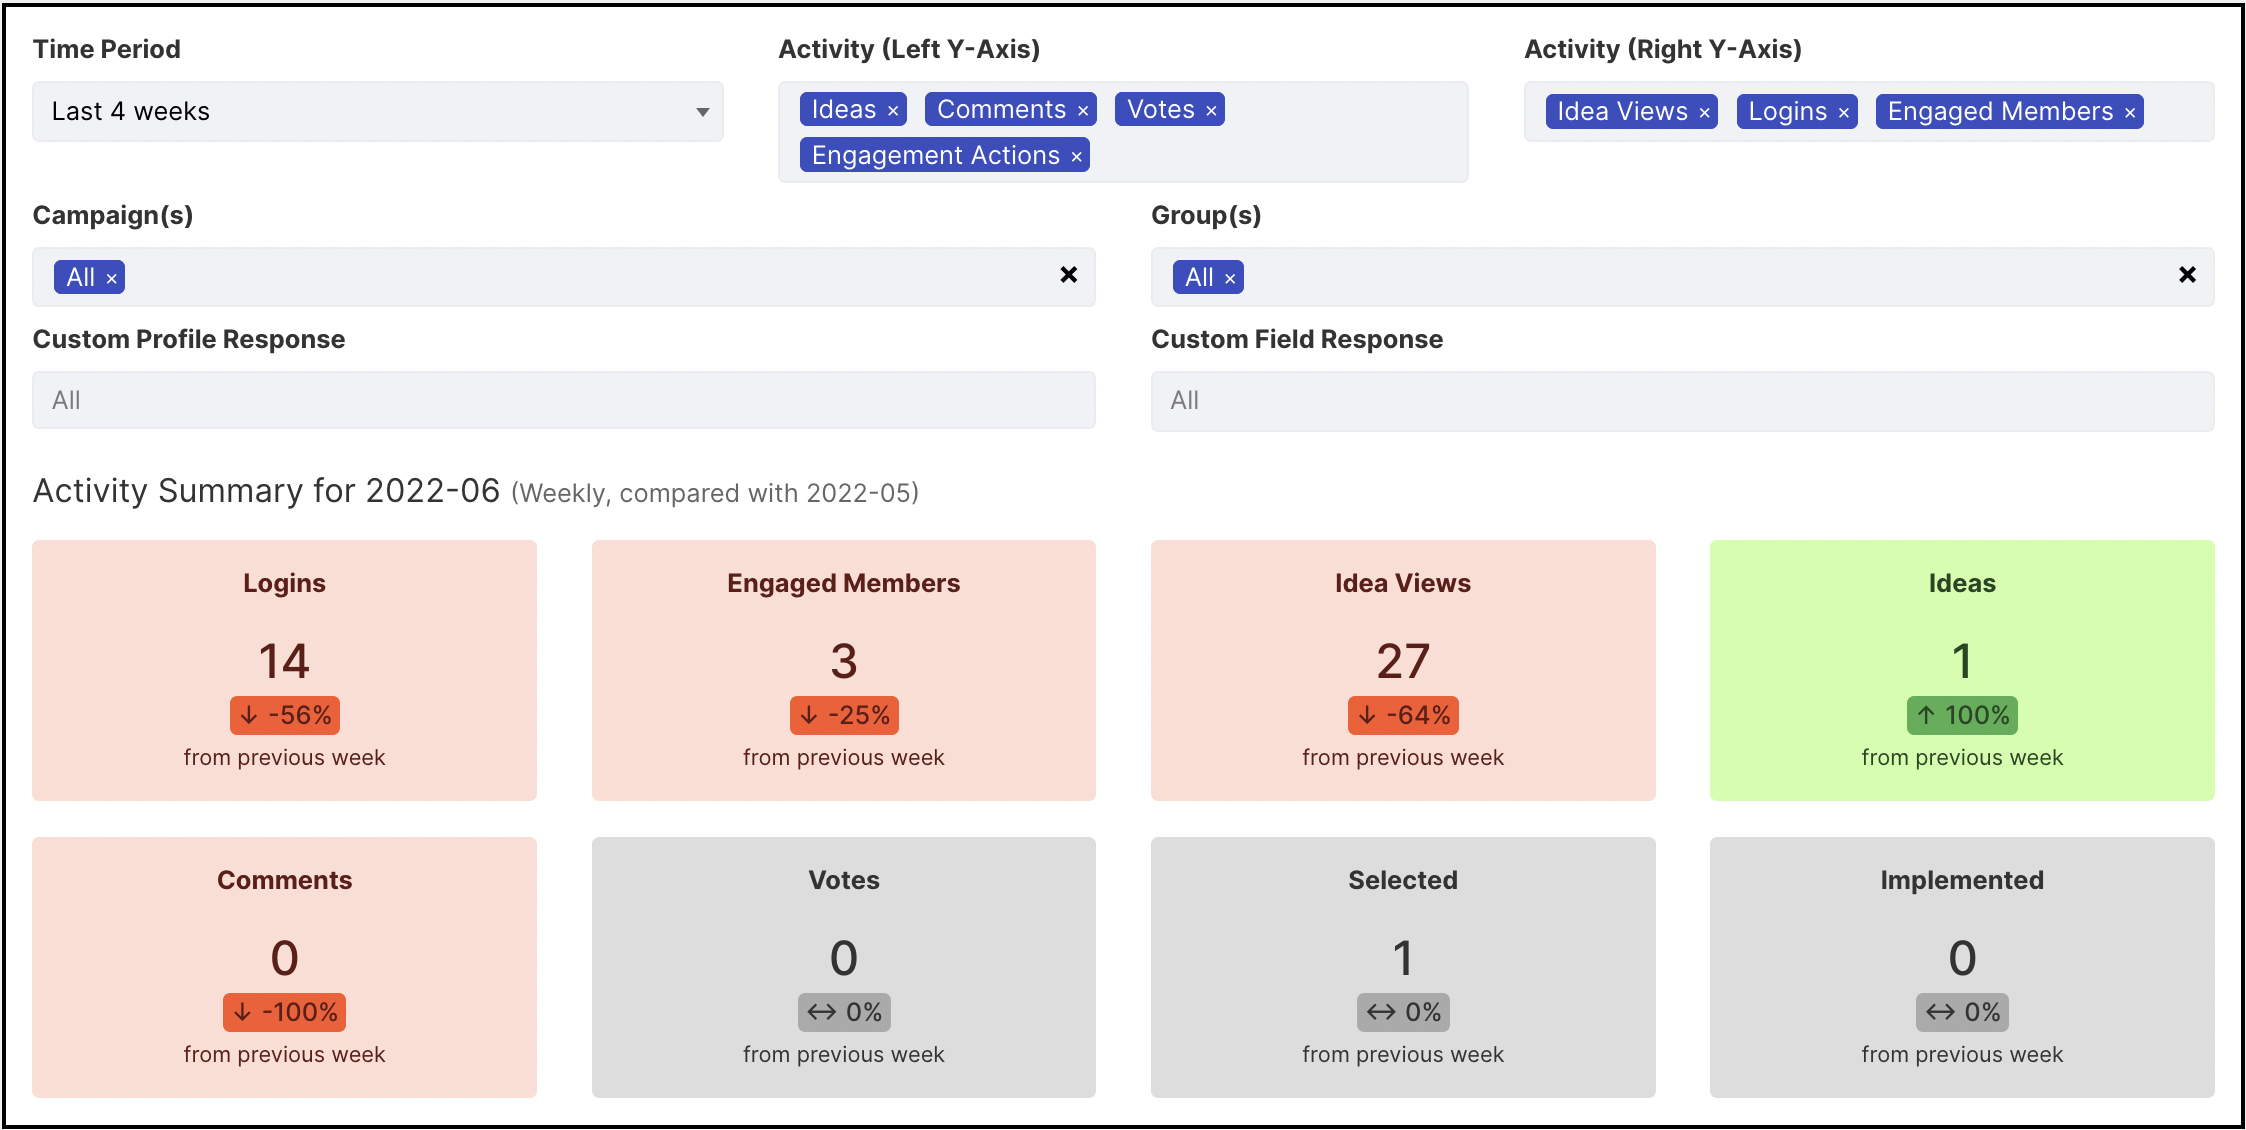
The activity summary provides cards of activity within your community for the selected period of time. It tracks the overall number of activities per period and the percentage (%) of those who took key actions.
Note: The Activity Summary Cards respond to the Time Period Selection as follows -
When set to any Weekly value (4, 8 or 12): Compares previous week to prior week
When set to any Monthly value (6 or 12): Compares previous month to prior month
When set to any Quarterly Value (4, 6 or 8): Compares previous quarter to prior quarter
You can use the filters at the top to display data by:
-
Time Period
-
Campaign (only display data for users who visited a specific campaign)
-
Group (only display data for users from a specific group)
-
Custom Profile response (only display data for users who gave a particular response to a custom profile question).
The following are the calculations made within this report, with the numbers provided corresponding with the purple numbers to the top right of each data type.
-
Logins: This shows the new users who logged into the community based on the selected date range and show % increase and decrease respecting the selected date range and comparing it with the previous week's date range.
-
Engaged Members: This shows the users who participated in the community activity based on the selected date range and shows % increase and decrease respecting the selected date range and comparing it with the previous week's date range.
-
Idea Views: This tile shows the number of Ideas viewed in all campaigns or a specific campaign. This will, in particular, show the Views Gained and Views lost respecting the selected date range.
-
Ideas: This will show the total number of the ideas submitted and show % increase and decrease respecting the selected date range and comparing it with the previous week's date range.
Count of ideas = Private Ideas + Pending Approval Ideas + Anonymous Ideas + Recycle Bin Ideas + Off Topic Ideas + Abuse/Duplicate + Deleted ideas + Deleted campaigns ideas + Nuke/ ban members ideas. -
Comments: This will show the total number of the comments submitted and show % increase and decrease respecting the selected date range and comparing it with the previous week's date range.
Count of comments = Private comments + Pending approval comments + anonymous comments + Abuse/ Duplicate comments + Deleted comments + deleted campaigns idea comments + nuke members comments. -
Votes: This will show the total number of the Votes cast and show % increase and decrease respecting the selected date range and comparing it with the previous week's date range.
Count of votes = Votes on Private Ideas + Votes on Recycle Bin ideas + Votes On/Off Topic Ideas + Votes on Rejected/Flagged Ideas + Deleted Campaign's Votes + Nuke/Ban member Votes. -
Selected: This will show the total number of selected ideas and show % increase and decrease respecting the selected date range and comparing it with the previous week's date range.
-
Implemented: This will show the total number of implemented ideas and show % increase and decrease respecting the selected date range and comparing it with the previous week's date range.
Most Active:
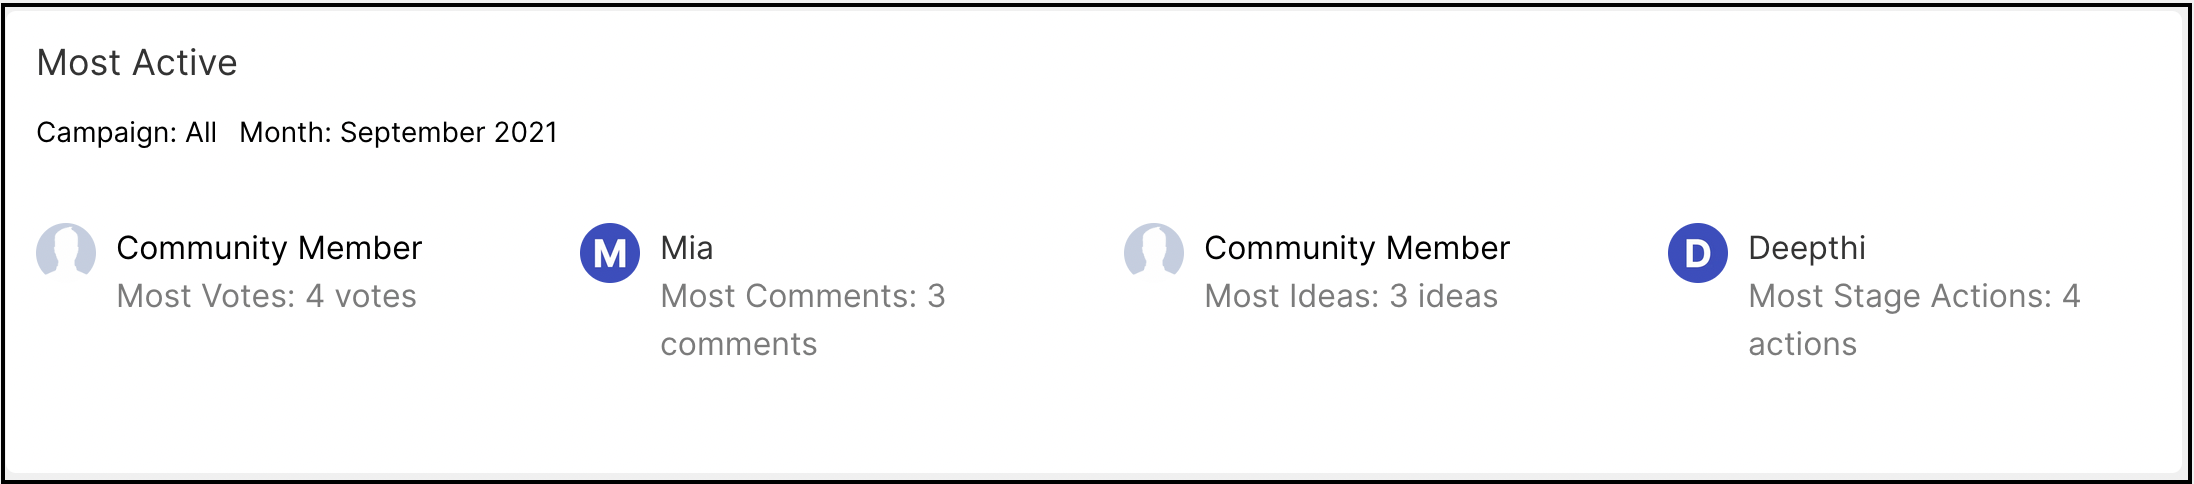
Most Active members provide a quick way to spot the top contributors to your community as a whole as well as each individual campaign. This is how you can track the individuals with the highest participation in 4 categories:
-
Most Votes = Up vote + down vote + Retract Up vote + Retract down vote + Votes on Private Ideas + Votes on Recycle Bin ideas + Votes On/Off Topic Ideas + Votes on Rejected/Flagged Ideas + Deleted Campaign's Votes + Nuke/Ban member Votes.
-
Most Comments = Private comments + Pending approval comments + anonymous comments + Abuse/ Duplicate comments + Deleted comments + deleted campaigns idea comments + nuke members comments.
-
Most Ideas = Private Ideas + Pending Approval Ideas + Anonymous Ideas + Recycle Bin Ideas + Off Topic Ideas + Abuse/Duplicate + Deleted ideas + Deleted campaigns ideas + Nuke/ ban members ideas.
-
Most Stage Actions = Build Team (Join Team) + Build Team (Assign Member) + Reviews Submitted + Estimates Submitted + Fund Submissions + Fund Submissions Modified + Assessment Submitted + Refine Question Answer submission.
All the data here is based on simple counts of activity within your community. This tool can be used to identify people to recognize as top contributors to the community. You can also link to your overall leaderboard using the View Leaderboard button at the bottom of the display.
Activity Trends:
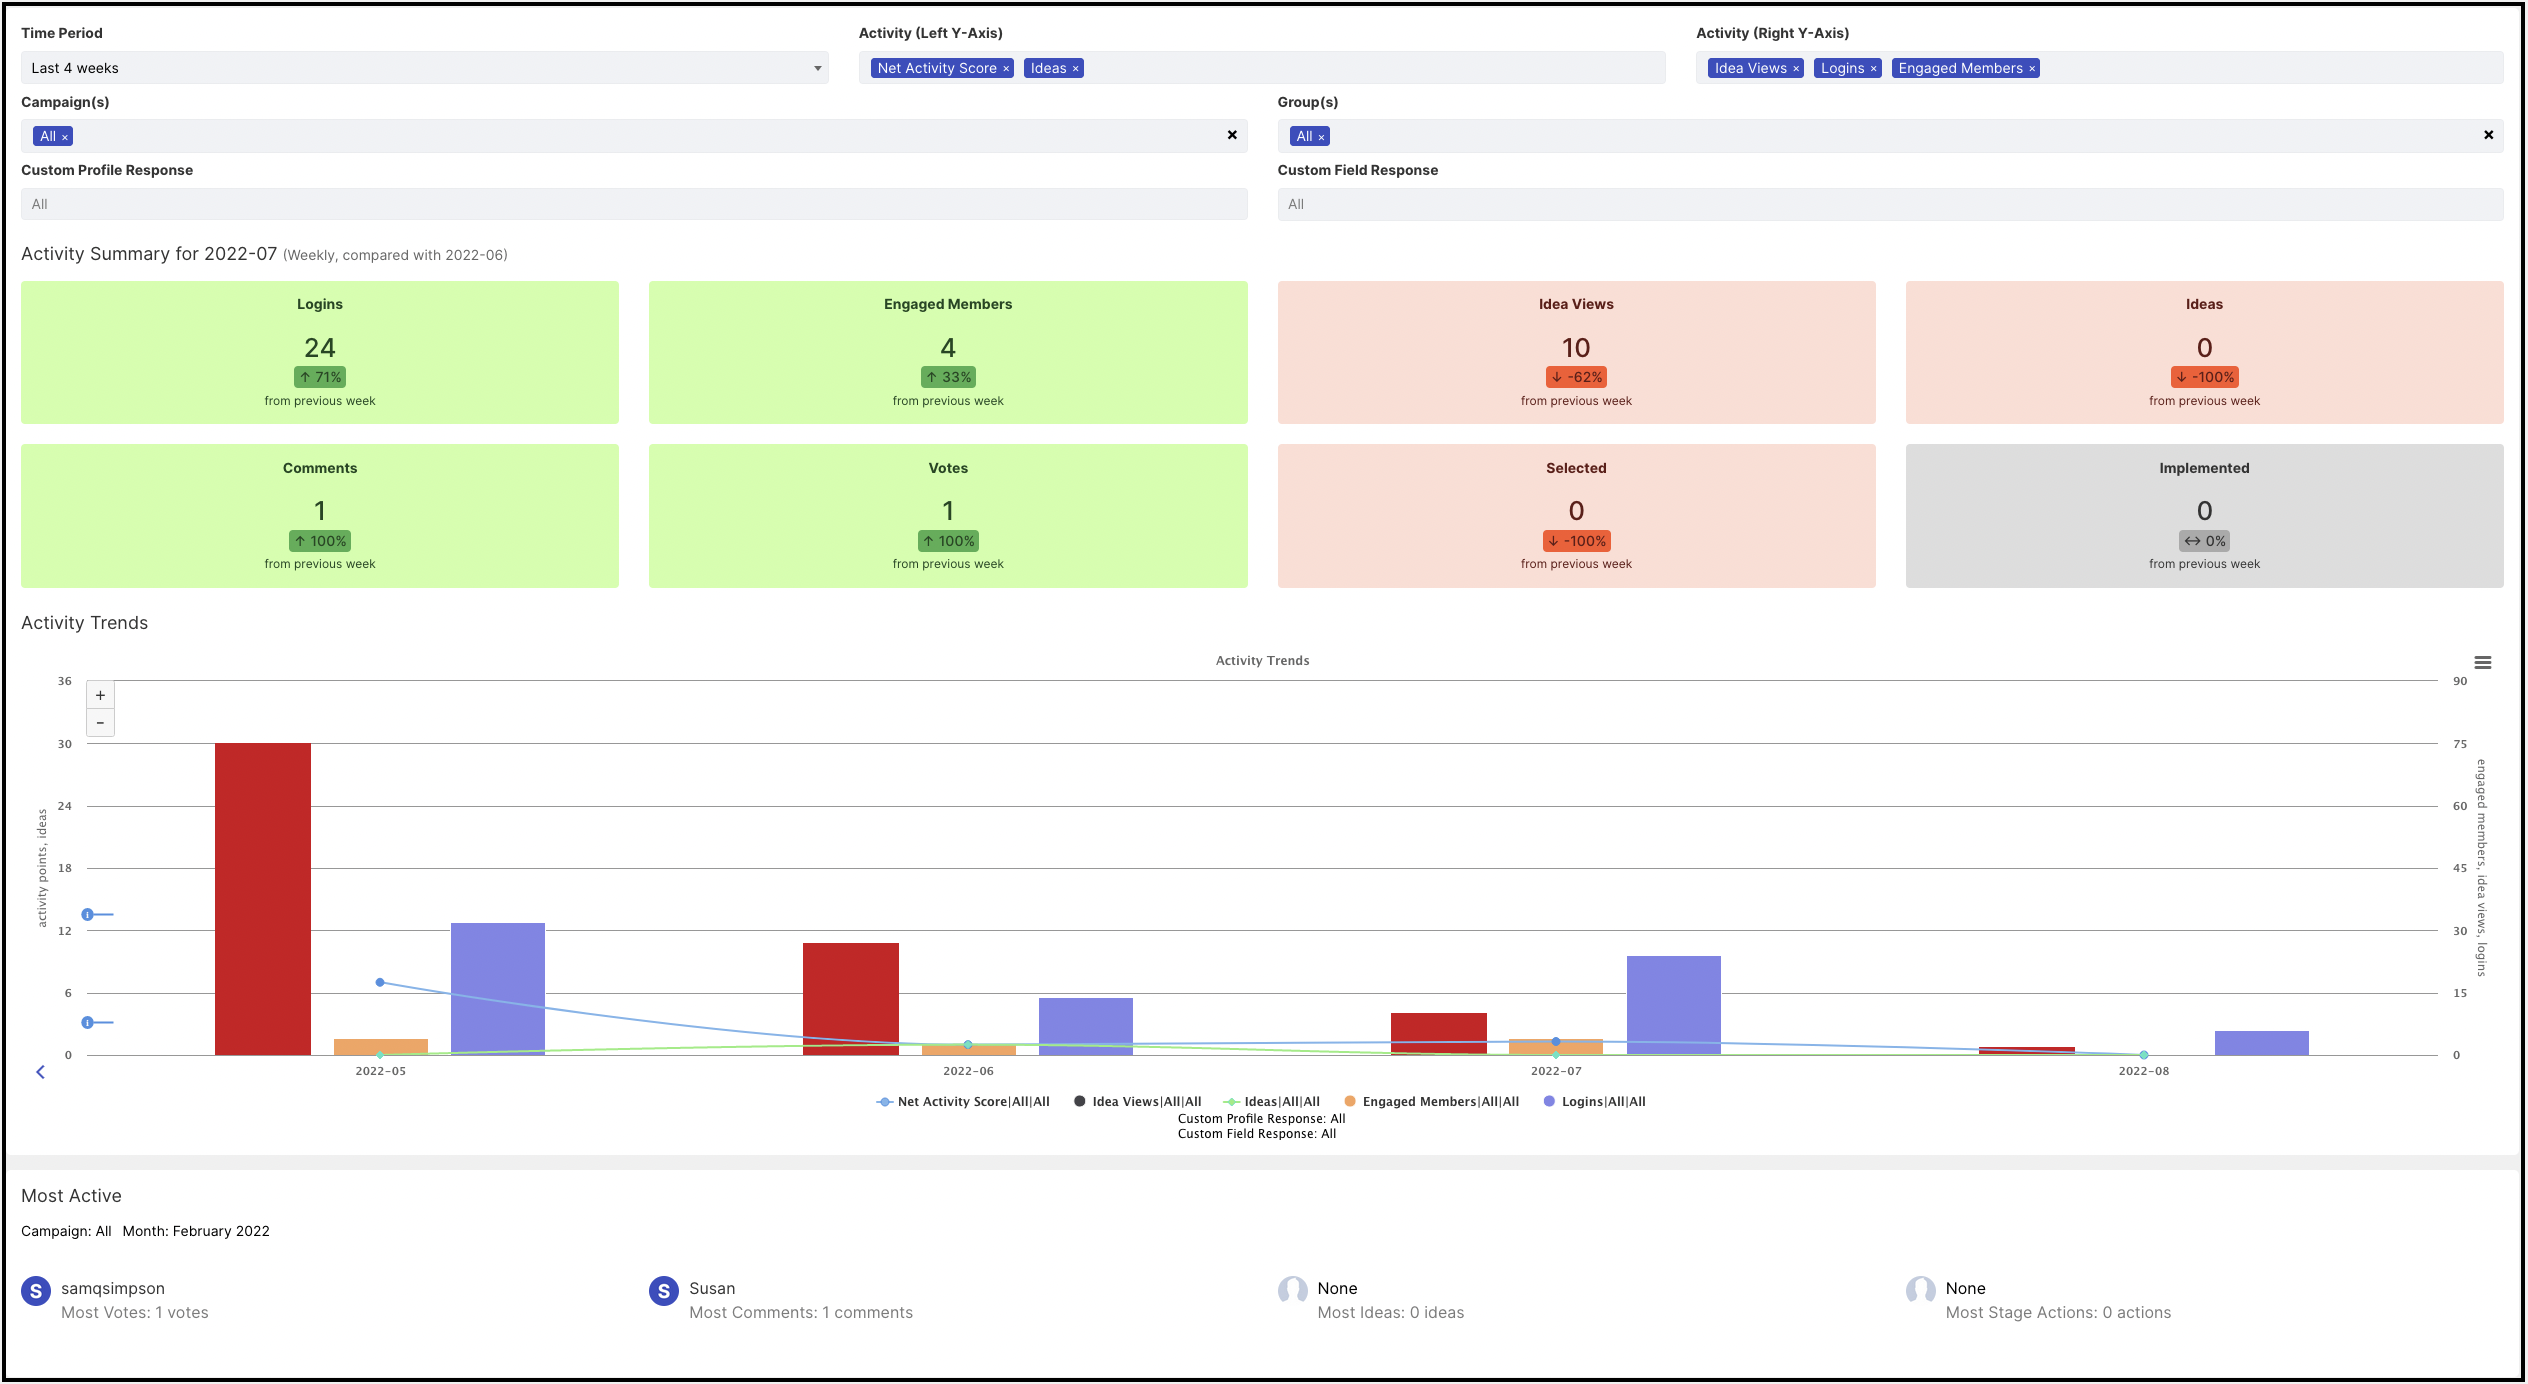
The Activity Trends graph lets you quickly monitor the activity of both members and moderators across the entire community, or from campaign to campaign.
One of the powers of this graph is the multitude of ways that the filters can be used to display specific segments of data. We recommend experimenting with the filters.
The filters available in our Activity Trends are as follows:
-
Time Period: Weekly (last 12 weeks), Monthly (last 12 weeks), and Quarterly (last 6 quarters)
-
Campaigns: All or select the campaign title from the dropdown.
-
Groups: All or select the group name from the dropdown.
-
Custom Profile Response: All responses, select answers for single choice or multiple choice.
-
Activity (Left Y-Axis or) and Activity (Right Y-Axis or): Net Activity score, Ideas, Comments, Votes, Idea Views, Stage Actions, Idea Stage Changes, Moderator Activity Count, Moderator Activity/Idea Submitted, Logins, and Engaged Users.
We have provided a summary of some key calculations below.
-
User activities such as commenting, voting, and idea submission are totaled through simple addition and provided in either a weekly or monthly breakdown. Filtering by group or custom profile response will display activity by specific segments of your crowd. Filtering by the campaign will show actions taken within that campaign. Filtering by custom field responses will filter for activity taken on ideas where that response has been selected.
-
The Net Activity Score is calculated by summing the key activities that occur within your community. Idea submissions, comments, votes, and stage actions are combined in a simple way to reflect the total activity in each of your campaigns (and over time). Votes are consistently more numerous than other activity types across IdeaScale communities. This is accounted for by weighting votes less than other activities. Also, ‘Downvotes’ are weighted less than ‘upvotes’. This leads to the following calculation:
Ideas + comments + (0.3 * (up votes - (0.8 * down votes))) + stage actions -
Stage Actions vs Idea Stage Changes: These two activity types sound similar, but are actually very different. It is, therefore, worth clarifying the different definitions. Stage actions total all the actions users have taken to contribute to non-ideate stages (such as reviews submitted, teams joined, etc). Idea Stage Changes totals all the times that ideas have changed stage. When recording the stage change data we are recording all activity without differentiating between “forward” and “backward” movement; moving 10 ideas back to your first stage will register as 10 stage changes, just as moving those same 10 ideas back to your second stage will register another 10.
Stage Actions = Reviews Submitted + Reviews Modified + Refinement Answers Submitted + Refinement Answers Modified + Estimates Submitted + Estimates Modified + Fund Submissions + Fund Submissions Modified + Assessment Submitted + Assessments Modified Idea Stage Changes = Number of times ideas within the system have changed stage (irrespective of the “direction of change”) -
When filtering activity data by Campaign we only display data relevant to that campaign.
-
When filtering by Custom Field Response we only display data pertaining to ideas that have that custom field response selected.
-
Within the Activity Trends data, five activity types are considered User Activities: Net Activity Score, Ideas, Comments, Votes, and Stage Actions. When filtering these activities by Group or Custom Profile response the filter will be applied by only including activities taken by members of that group and/or members who had selected that Custom Profile Response. So, for example, when filtering for Activity = “votes” and filtering for Group = “Sales” we would be looking at the following data:
number of votes cast by members of the group sales on all ideas -
Within the Activity Trends data, three activity types are considered Moderator Activities: Idea Stage Changes, Moderator Activity Count, and Moderator Activity / Idea Submission (which is a ratio of moderator activity per idea submission). When filtering these activities by Group or Custom Profile Response the filter will be applied by only including activities taken on ideas where the submitter was a member of that group and/or had selected the appropriate Custom Profile Response. So, for example, when filtering for Activity = “Moderator Activity Count / Idea Submission” while filtering for Group = “Sales” we would be looking at the following data:
number of actions taken by moderators on ideas submitted by members of the group “sales” / number of ideas submitted by members of the group “sales”
To learn more about Activity Trends, click here.
Stage Activity Snapshots:
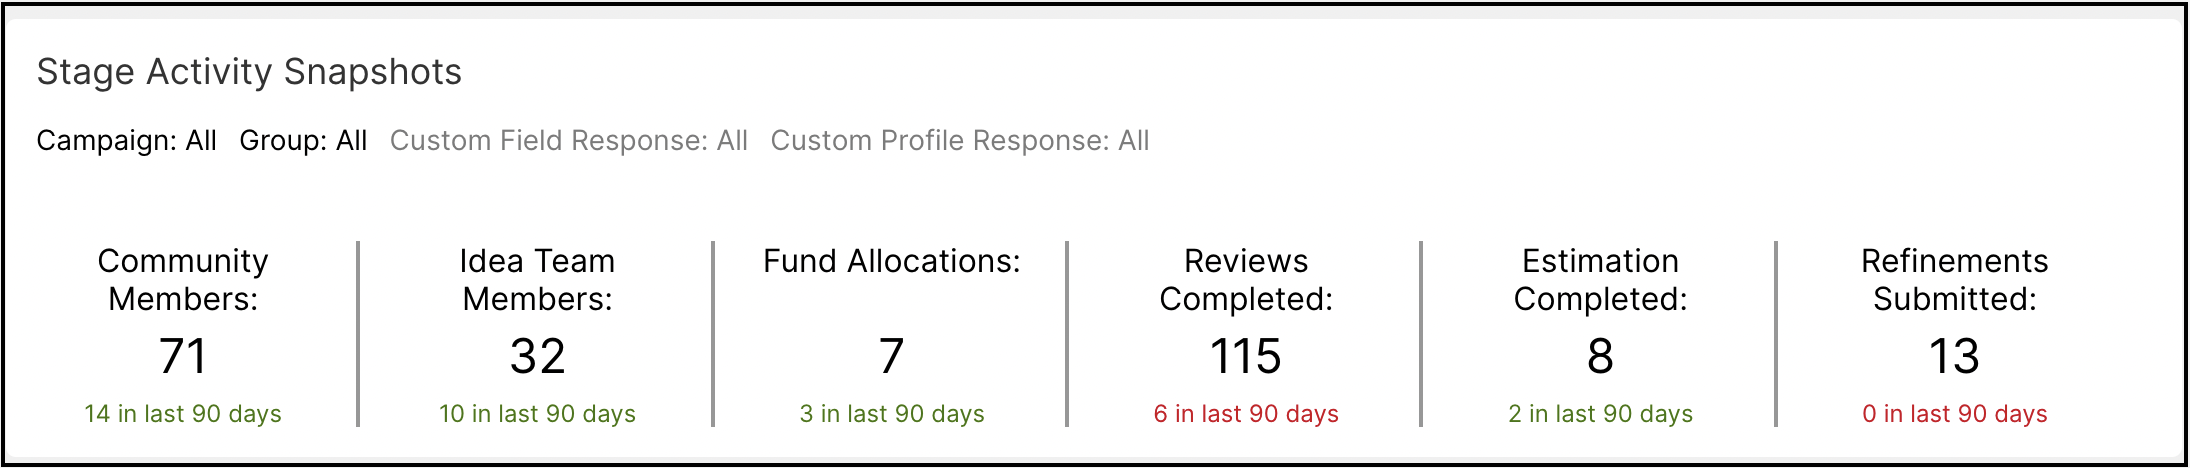
The Stage Activity Snapshots give a quick overview of how much activity related to each stage type has been taking place within your community. The main numbers provide your community’s lifetime total activity within each category, the line below each of the headline numbers lets you know how much activity has occurred over the last 90 days and the color indicates the direction of change (green for higher than average activity and red for lower than average activity).
-
Community Members - Total Community Members (excluding banned or purged members)
-
Idea Team Members - (Idea Team members who join a team + idea team members who are assigned to a team) - team members who are unassigned from or leave a team
-
Fund Allocations - Number of times users have pledged funds to an idea. This is based on the “MEMBER_PLEDGE_FUND” event and counts each pledge (including if a single user pledges to the same idea multiple times)
-
Reviews Completed - # of times an individual user has completed ALL review questions on a particular idea + # of times an individual user has completed ALL assessment questions on a particular idea
-
Estimation Completed - # of times individual users have completed all estimates for a particular idea.
-
Refinements Submitted - # of times all refinement questions are completed for an idea