Overview of Reporting Beta dashboard
Path: Workspace Homepage >> Apps Icon >> Reporting
Path: Community Topbar >> Apps Icon >> Reporting
Dashboards on the platform serve a vital role in monitoring performance, enhancing engagement, making data-driven decisions, and facilitating communication. The reporting dashboards provide a unique method for Workspace and Community administrators to track key metrics on the Ideascale platform. This allows them to quickly assess the performance of their workspace or community. Additionally, these dashboards can be customized according to the metrics that are most relevant to you, enabling you to optimize your use of the platform effectively.
The dashboard page consists of 4 elements:
List of Dashboard
Create Dashboard
Manage Dashboard
Actions
List of Dashboard
Dashboard section features a dropdown menu displaying a list of previously created dashboards. Admins can effortlessly select their preferred dashboard from this menu to analyze user engagement and gain insights into community interactions. 
By default, the system creates several dashboards for all workspaces to get started.
Legacy Dashboard: This dashboard provides valuable insights into various metrics, including daily and weekly idea views and submissions, as well as daily comments, votes, and submissions related to those ideas. It also tracks weekly trends in idea views and comment votes, enabling administrators to monitor user engagement effectively.

Campaign Report: The Campaign Report gives a campaign-wise graphical representation for all the communities within the workspace, based on Campaign ideas submitted (Bar graph for the number of ideas submitted in each campaign), Unique campaign visits (Pie chart for the number of unique visit per campaign), Campaign total engagement (Bar graph for the number of engagement actions per campaign), Campaign total votes (Bar graph for the number of votes per campaign), and Campaign Leaderboard (Table format for the number of ideas submitted, numberof comments, number of idea votes and number of comment votes)

Engagement Tracker: The Engagement Tracker gives an overview of the total engagement within all communities in the Workspace based on Idea views, Ideas submitted, User Engagement (Total Logins & Engagement members in a Line Graph) and Engagement Actions (Total number of Engagement actions in a Line Graph).

Outcomes: The Outcomes Dashboard gives an overview of the total number of Selected ideas, Implemented ideas and other ideas graphical and numeric format.

Filters in Dashboard
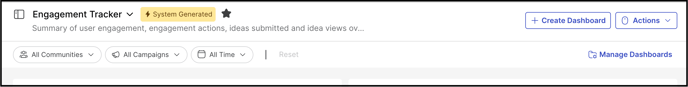
The dashboard features intuitive filters that enable you to refine your search and quickly locate information relevant to a specific community or campaign. The available filters include Community, Campaign, and Time, allowing for a streamlined analysis of metrics.
Create Dashboard

You can easily create a dashboard in just a few clicks by selecting elements from the available list to display. After entering a name and description for your dashboard, you will be presented with a selection of charts that can be added. Don’t forget to save your changes by clicking the button in the top right corner of the dashboard.
Manage Dashboard

This page presents a comprehensive list of dashboards created by you and other administrators. Each entry includes the dashboard title, creation date, the name of the creator, and an Actions tab. You can easily mark a dashboard as a favorite by clicking the star icon located next to its title.
Actions

This tab gives a list of actions that you can perform pertaining to the dashboard.
Here is a list:
1. Add reports to dashboard
2. Set Default Dashboard
3. Export dashboard to CSV
4. Export dashboard to Excel
5. Rename dashboard
6. Add to favourites
7. Clone Dashboard
8. Delete Dashboard
Note: The system-generated dashboard is fixed and cannot be deleted or modified to include additional charts.