Path: Profile Dropdown >> Reporting & Analysis >> Outcomes
This article will walk you through the different areas of the Outcome Dashboard.
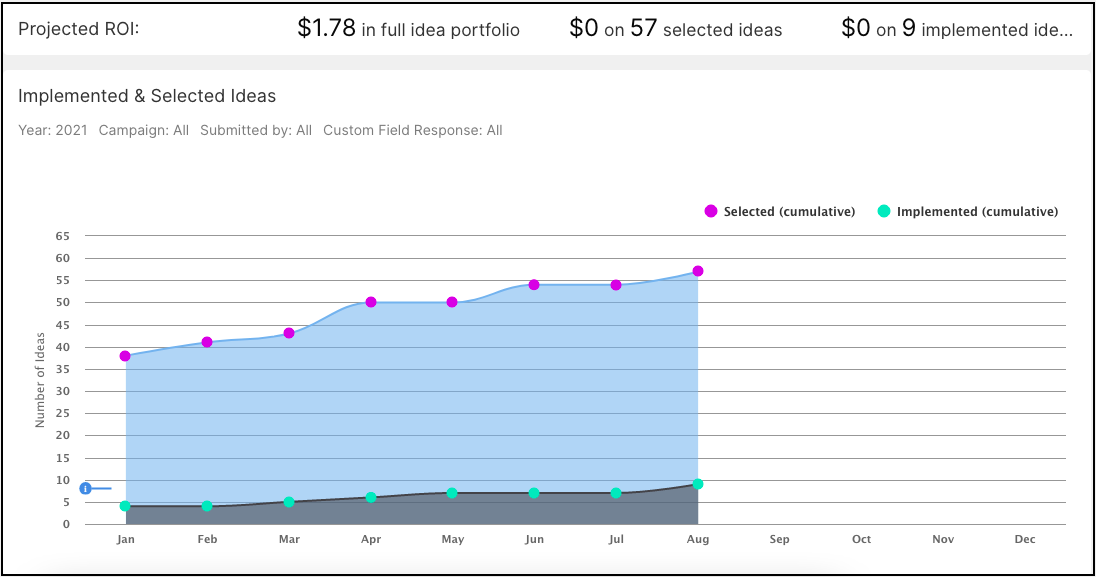
Projected ROI

Shows total ROI values in community by how much money is associated to all ideas in the community, how much is associated to selected ideas, and how much is associated to implemented ideas.
Admin can enable estimate ROI which can be displayed in Hour, Token, USD, EUR, GBP, JPY, AUD, CAD, HKD, CHF, AED and WD.
Implemented & Selected Ideas
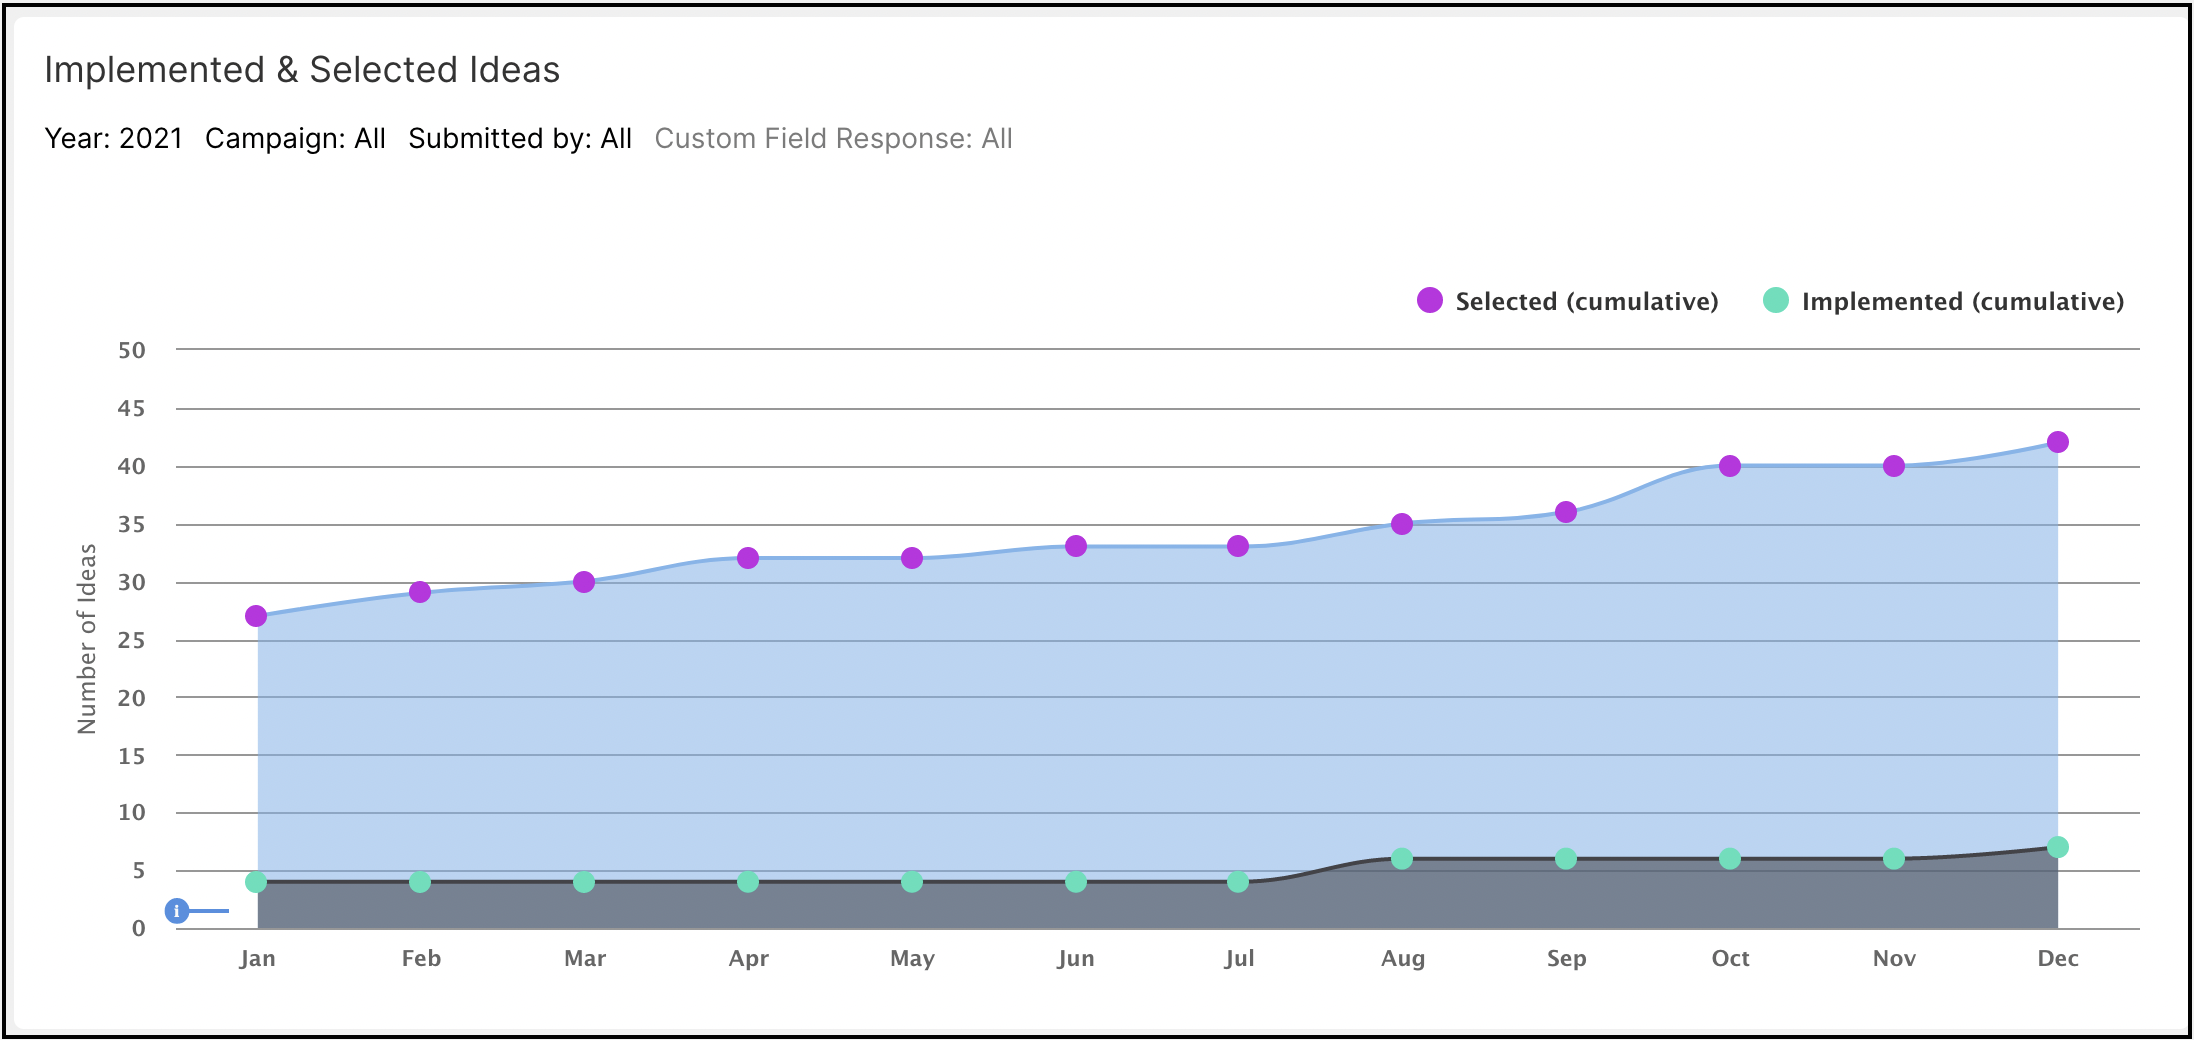
The Selected and Implemented Ideas graph allows you to easily track the outcomes from your community (in terms of number of ideas successfully implemented). You can filter by: Year, Campaign, Submitted by (Group Name), and Custom Field Response.
For each stage you'll want to determine, “Do I consider ideas in this stage to be selected, implemented or neither?” and make your selections for each stage accordingly. Read the section below to learn how to bucket, by funnel stage, your member's ideas.
Bucketing Ideas into Selected or Implemented:
To set up tracking for “Selected” and “Implemented” ideas go to Community Settings > Workflow > Funnel Management > Edit for the funnel you'd like to update. Under Idea Stages, chose "Selected" for a stage that contains ideas selected for implementation or chose "Implemented" for a stage that contains ideas that have been implemented.
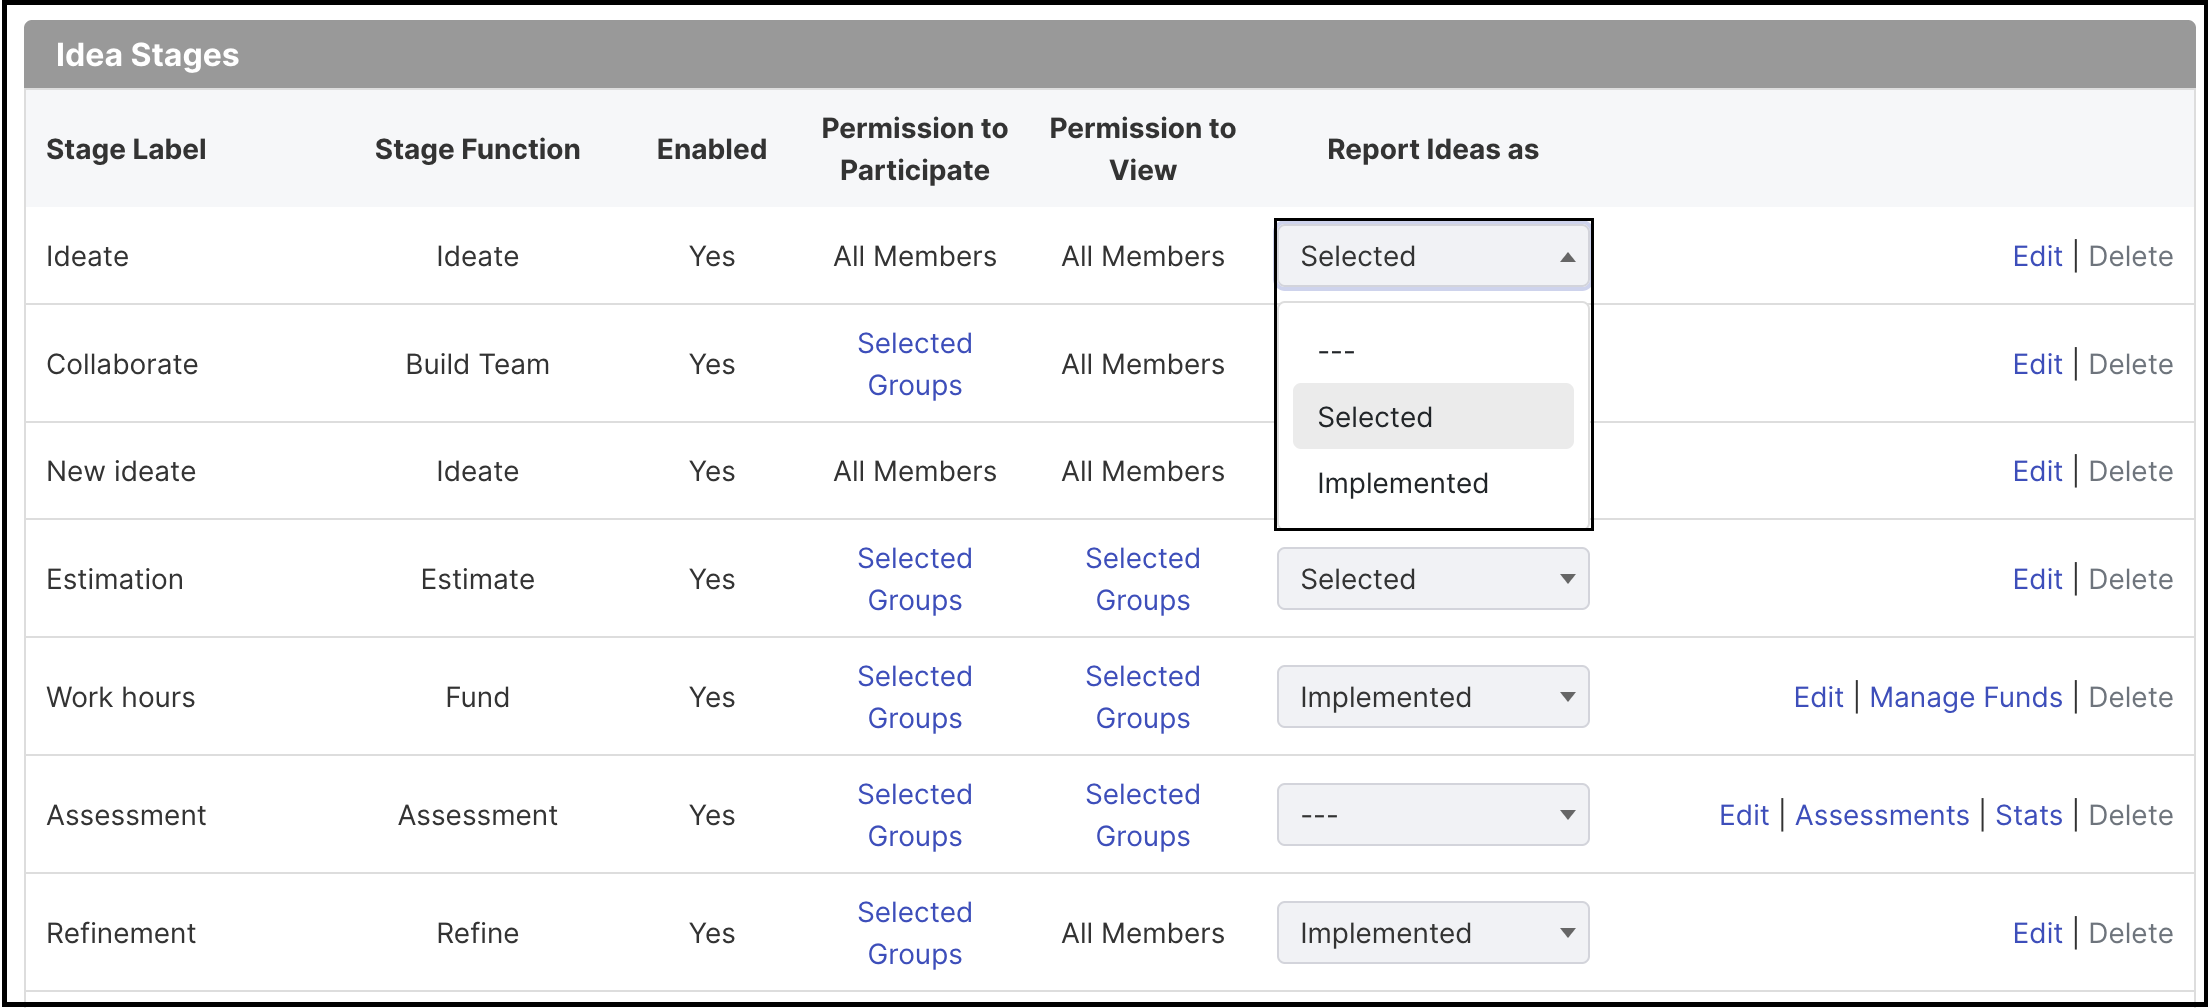
Once this is set up, any idea in a selected or implemented stage will be tracked within the Outcomes Report. It is important to make sure you mark every stage correctly, as incorrectly marked stages may end up causing ideas to have incorrect timestamps for when they were selected and/or implemented.
Looking to understand how the timestamps are generated? Read on for an in-depth breakdown of the expected behavior below.
Completion Summary

Completion Summary provides the number of implemented ideas, the number of selected ideas, and the number of “other” ideas that have not reached either of these two criteria. The numbers provided are the all-time statistics for your community. Use this quick summary to monitor your progress in selecting and implementing ideas.
Idea Leaderboard
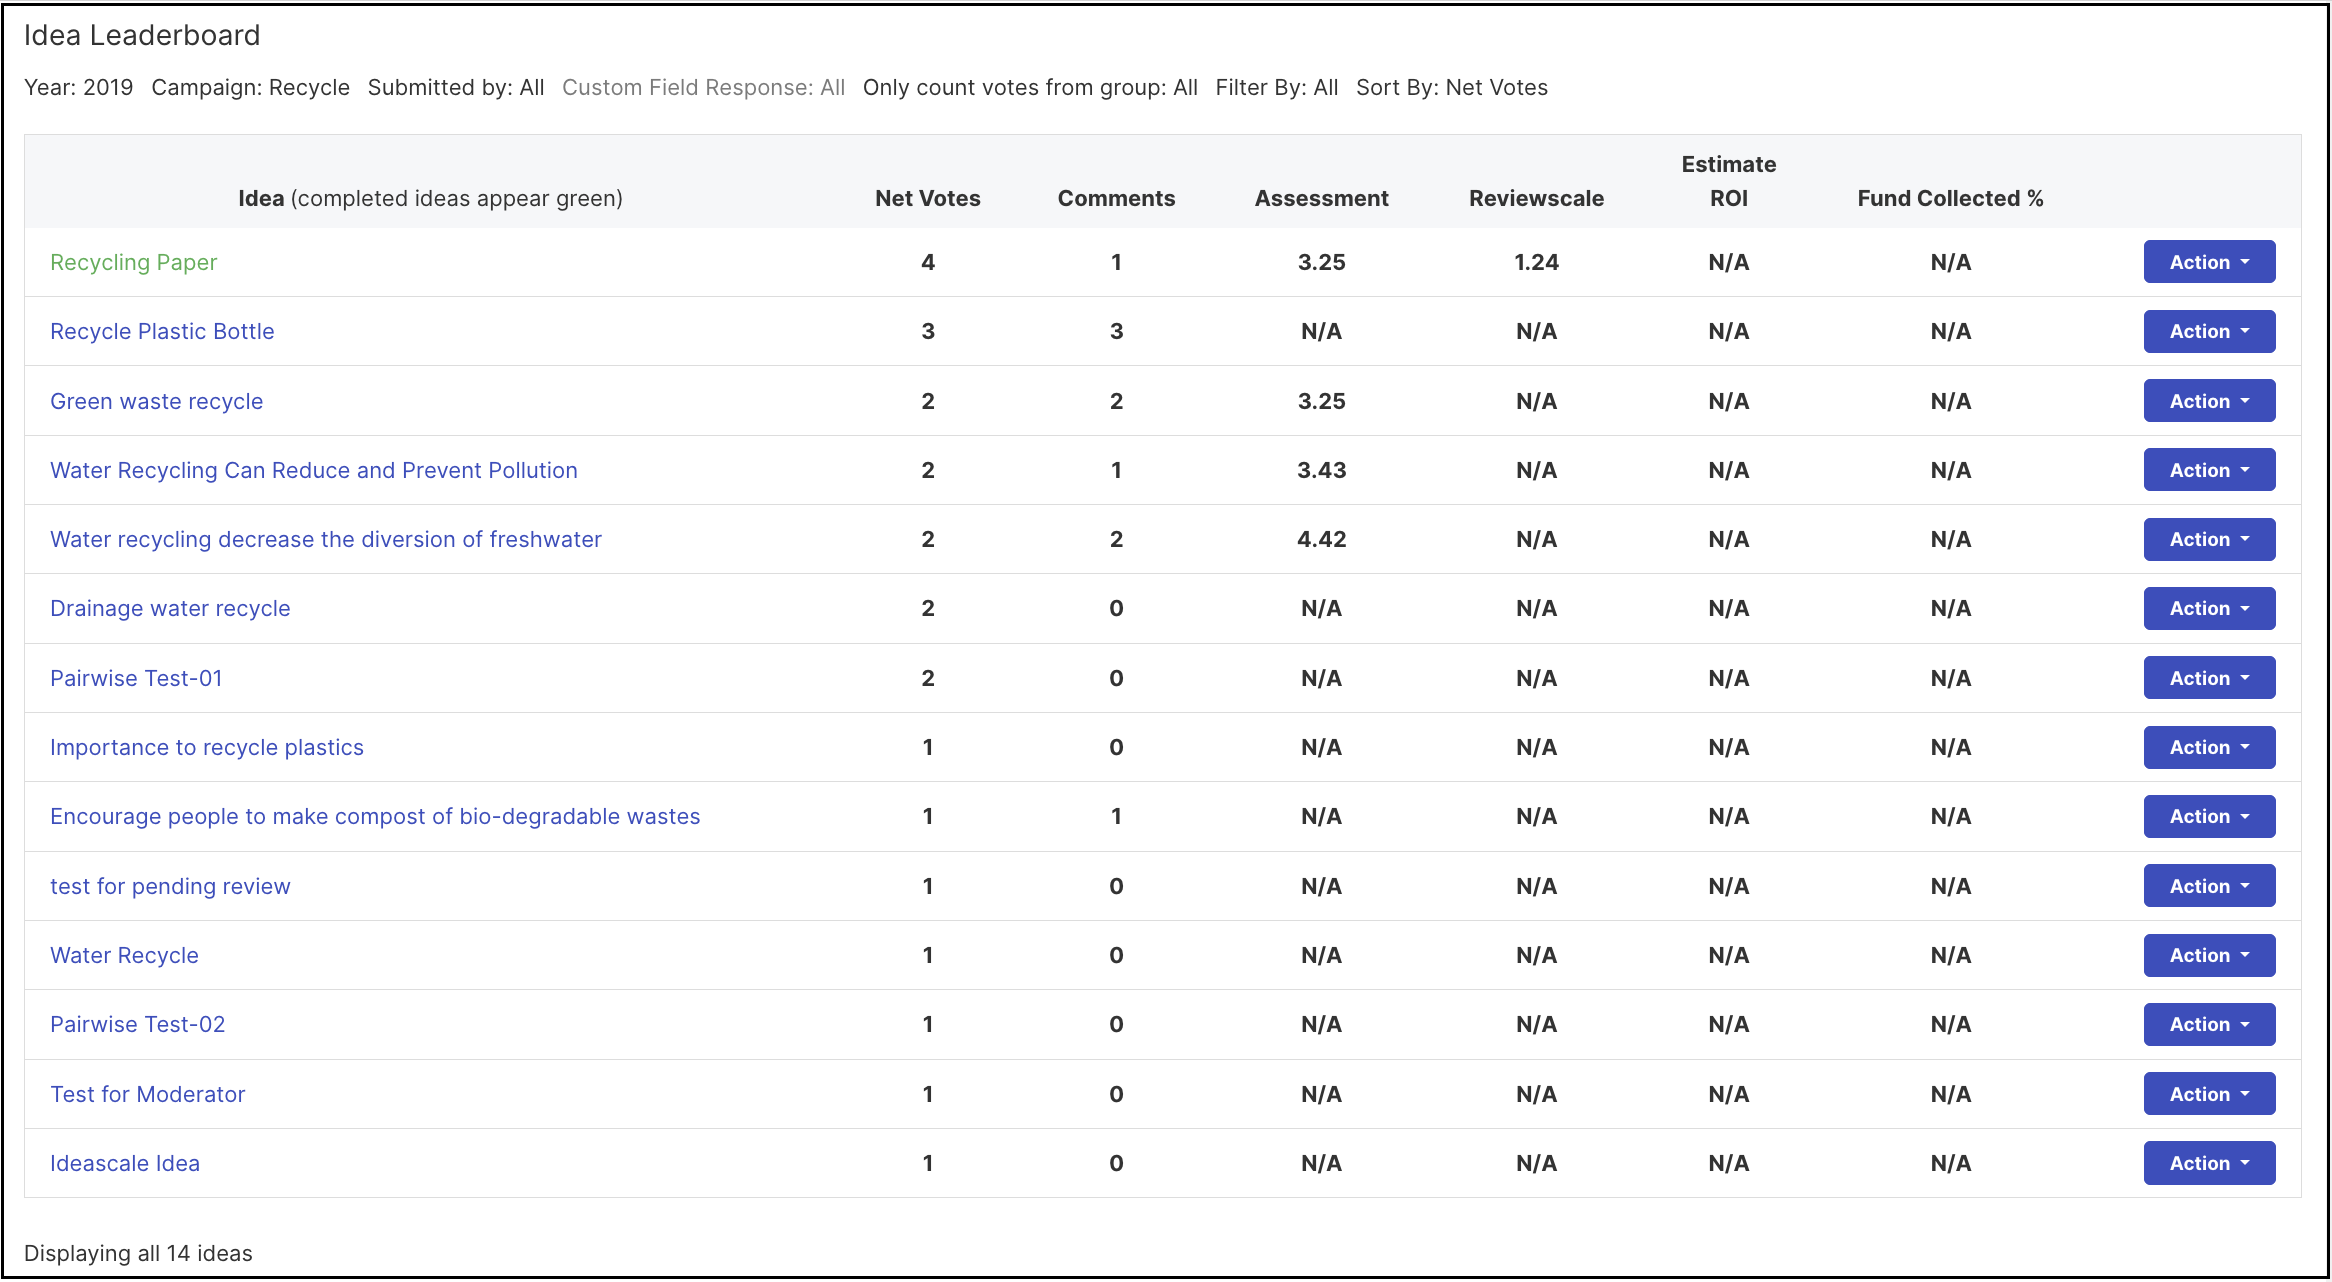
The Idea Leaderboard lets you sort ideas according to various metrics (or ‘score-types’) within IdeaScale. You can see which ideas received the most comments, the most votes, which ideas scored best in review stages, and which ideas had the best ROI predictions assigned during estimate stages. Sort the table by these metrics using the “Sort By” dropdown menu.
You can filter the display by; Year the Ideas were Submitted, the Campaign Name, Submitted by (Group Name), Custom Field Response, Votes by X Group, All Implemented Ideas or Not, and Sort by.
You can also take action on specific ideas right from the Dashboard! By clicking the black 'Action' button, you can move the idea into different stages in the funnel.
One important thing to note is that the year filter in the idea leaderboard filters by the date the idea was submitted, not the date the idea was selected or implemented. This means that the ideas included in each year will be different from those included in each year for the Selected and Implemented idea graph and customers should not be alarmed if such differences are spotted.
Outcome & Engagement Alerts
These Alerts can be seen on the right-hand side of the Outcomes Dashboard and are bucketed into two categories: Outcomes & Engagement. Within these two buckets, there are seven types of Alerts you might see (details below). For each Alert, you can see what the Alert is indicating, details, date when the Alert was triggered, and helpful links that are specific to that Alert.
-
Drop-in Submission: will trigger when a campaign has seen a 20% drop in submission over the last week
-
Less than 50% of ideas received a comment: triggers when less than 50% of ideas submitted to your community are receiving a comment
-
Slow Start in the campaign: triggers when a campaign is 15 days old and has less than 10 ideas
-
No ideas implemented this month: triggers when no ideas get moved to implemented in the current month
-
One week left: triggers from the end date on a campaign
-
Aging ideas (45 days): triggers when the average time spent of ideas in a certain stage is over 45 days
-
Aging ideas (3 months): triggers when the average time spent of ideas in a certain stage is over 3 months